


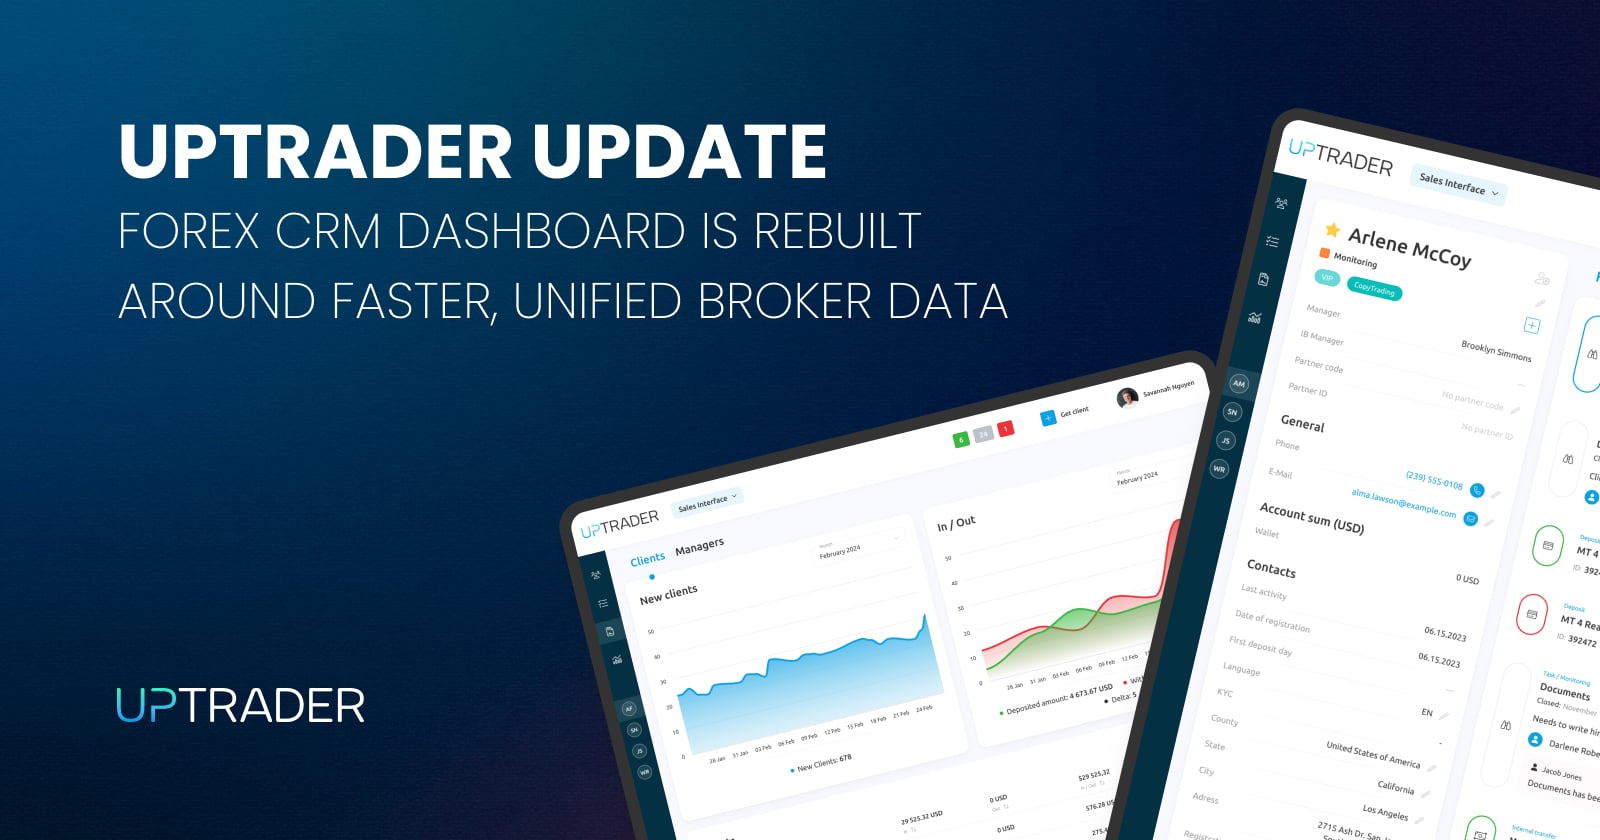
UpTrader Rebuilds Its Forex CRM Dashboard Around Faster, Unified Broker Data
Share this publication:
A dashboard is not a report with better colors. That sounds obvious, but look at how most forex CRM vendors treat dashboards and the distinction starts to blur. They give you a screen with charts. Those charts pull from whatever data the system happens to have cached. The numbers update when someone refreshes the page or when a scheduled job runs. And the moment you need to see deposits alongside client growth alongside IB performance alongside trading activity for a specific date range, you are back to exporting spreadsheets and stitching the picture together manually.
For a long time, that was acceptable. Dashboards were a visual convenience layer. The real work happened in spreadsheets, in admin panels, in PSP portals, in trading platform managers. The dashboard was nice to glance at. Nobody actually ran their brokerage from it.
That era is over. In 2026, the brokerages that move fastest are the ones whose leadership, operations, and sales teams can see what is happening across the entire business in real time, from a single screen, without waiting for someone to compile anything. Dashboard architecture has stopped being a UI decision and become a competitive advantage.
The Problem With Forex CRM Fragmented Operational Data
Here is what daily operations look like inside a brokerage where the dashboard layer was not built to unify data.
Your head of sales wants to know how many new clients registered this week and how many have deposited. That data lives in the CRM, but the deposit totals need to be cross-referenced with the payment module. Your compliance manager wants to see KYC approval turnaround times alongside client onboarding volume. That requires pulling from two different system views. Your finance team needs deposit and withdrawal totals by PSP for the month. They export a report, open a spreadsheet, and start filtering. Your IB manager wants to see which partners are generating the most funded accounts, not just registrations. That means combining partner attribution data with deposit records and trading account activation, which sit in three different areas of the back office.
None of these requests are unusual. They are the standard questions that brokerage leadership asks every day. And in most forex CRM environments, answering them requires navigating multiple screens, running separate queries, or asking someone to manually compile the numbers. By the time the picture is assembled, it is already hours old.
The operational cost is not just time. Delayed visibility means delayed decisions. A deposit volume drop that should trigger an investigation on Monday does not surface until Wednesday's report. A top-performing IB whose referral quality is declining does not get flagged until the monthly review. A spike in withdrawal requests that might indicate a client satisfaction issue gets noticed after the damage is done, not while it is still developing.
Why the Aggregation Engine Matters More Than the Interface
Most dashboard redesigns focus on the visual layer. Better charts. Cleaner layouts. More widgets. That is cosmetic. The problem that actually needs solving sits underneath the interface, in how the dashboard pulls, combines, and serves data from across the brokerage operation.
A unified data aggregation engine is the architectural layer that collects data from every operational source, the forex CRM, the back office, the payment layer, the trading platform integration, the IB module, normalizes it, and makes it queryable from a single point. Instead of each dashboard widget running its own database call against its own data silo, every widget draws from the same aggregated dataset. That is what makes cross-functional views possible without manual assembly.
Speed matters here, and not in the abstract "performance optimization" sense. When a dashboard takes 8 to 12 seconds to load because it is running separate queries against separate tables for each section, your team stops using it. They revert to spreadsheets. They build their own tracking systems. The dashboard becomes a decoration. A fast aggregation engine that serves pre-unified data means sub-second loading, which means the dashboard becomes the first place your team looks, not the last.
Flexible date-range querying is the other capability that determines whether a dashboard is genuinely operational. "How did we perform last week" is a different question than "what happened on Tuesday" or "show me Q2 versus Q1." If the dashboard only shows a fixed time window, current day or current month, every historical comparison requires an export. Date flexibility turns a monitoring tool into an analytical one.
What UpTrader Forex CRM Rebuilt and Why It Matters
UpTrader recently completed a full redesign of its Dashboard Module, and the meaningful change is not the visual refresh. It is the unified data aggregation engine underneath it.
The new architecture pulls deposits, withdrawals, trading activity, client growth, partner performance, and account activity into a single aggregated layer. Every dashboard view, whether accessed by a client in the trader room, by an individual back office user, or by a brokerage owner looking at global operations, draws from the same unified dataset.
That structural decision enables three tiers of dashboard access that were not previously possible without manual data assembly.
Client Interface dashboards give traders a clear view of their own account activity, deposit and withdrawal history, and trading performance. The data is personal, scoped to the individual client, and rendered from the same engine that powers the internal views. Consistency between what the client sees and what your team sees eliminates the support tickets that arise when numbers do not match across interfaces.
Back office per-user dashboards give each internal team member a view tailored to their role. A compliance officer sees KYC queue depth and approval rates. An employee in the finance department has access to payment volumes, and reconciliation status, whereas a sales representative is able to view lead conversion as well as client activities. While each user is allowed to access certain information based on their role in the organization, the system still maintains one database instead of separate databases used by different departments. A sales agent who needs to check whether a lead has deposited does not need to switch to the finance module. The dashboard already includes that data point within their permitted view.
Global broker dashboards give leadership a cross-functional view of the entire operation. Deposits, withdrawals, new registrations, funded accounts, trading volume, IB performance, and operational trends, all visible in a single interface with flexible date-range filtering. Daily views show what is happening right now. Summary views show how the numbers trend over weeks and months. Both draw from the same aggregation engine, so the daily number and the monthly total are always consistent.
Faster loading across all three tiers is a direct result of the unified engine. Instead of each widget querying independently, the dashboard serves pre-aggregated data. The difference between a dashboard that loads in under a second and one that takes ten seconds is the difference between a tool your team uses reflexively and one they avoid.
The Competitive Advantage Nobody Talks About
Nobody markets dashboard architecture as a competitive differentiator. Vendors talk about integrations, compliance automation, IB management. Dashboards get a bullet point and a screenshot.
But consider what a brokerage with genuine real-time operational visibility can do that a brokerage running on spreadsheets and delayed reports cannot. They spot deposit volume drops the same day, not three days later. They identify underperforming IB partners before those partners churn. They catch withdrawal spikes that signal client dissatisfaction while there is still time to intervene. They answer leadership questions in seconds instead of asking someone to compile a report by end of day.
None of that is possible when your data sits in silos that require manual assembly. All of it becomes routine when the aggregation layer unifies everything your brokerage generates into a single, fast, queryable dataset.
The dashboard is not a report with better colors. It is the layer that determines how quickly your brokerage can see what is happening and act on it. That speed gap, between brokerages that operate on real-time unified data and brokerages that operate on yesterday's spreadsheet, compounds every single day.
If any of this sounds like the operational visibility gap you are trying to close, UpTrader can show you how its redesigned dashboard and unified aggregation engine work with your specific brokerage data.
The demo is built around your operation, not a generic walkthrough. Request it here